| Cascade DataHub™ : Version 6.4 | ||
|---|---|---|
 | Chapter 13. Other Windows and Programs |  |
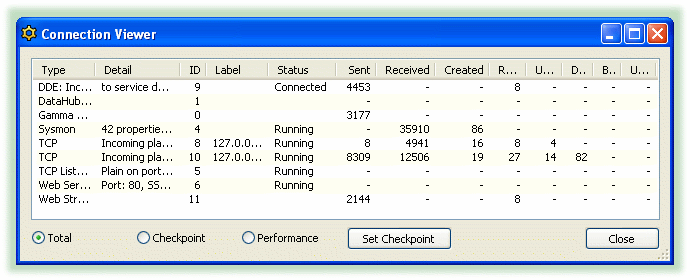
This window gives a real-time view into all Cascade DataHub connections. You can open this window by clicking on the button in the Properties window.

The various columns identify the connection and show its status, with connection statistics, as follows:
Sent - point changes sent from the DataHub to the connecting program.
Received - point changes sent from the connecting program to the DataHub.
Created - data points created in the DataHub by this connection.
Registered - data points registered in the DataHub by this connection.
Unregistered - data points unregistered in the DataHub by this connection.
Dropped - data point changes that the Cascade DataHub attempted to send, but could not, because the client was too busy to receive them before the next point change. When the DataHub drops a point change, it only drops values that have already been superseded by a newer value. The Cascade DataHub will never drop the latest value.
Blocked and Unblocked - If the Cascade DataHub identifies that the client is unable to keep up with the transmission data rate, it will mark the client as blocked, indicating that the client will receive no new value changes until it is able to cope with them. The DataHub unblocks the client after a short period of time, or when it identifies that the client has queue space to accept new data changes.
If a client is blocked, superseded point changes will be dropped. The latest value for each point is queued so that when the client is unblocked it will receive the latest values for all points that changed while it was blocked. Again, the Cascade DataHub never drops the latest value for any point in which a client is interested.
CPU - the CPU time in seconds that a given thread has consumed since it started. When the option is selected, the CPU percentage is the average percentage of the CPU resources that the thread has been using since the Connection Viewer window was opened, or the button was pressed.
You have the following options for viewing the data:
displays all connection statistics from the time that the client connection was first made.
displays all connection statistics from the last time the button was clicked or from the time that the client started, whichever is later.
shows the performance of the connection, in terms of data changes per second, from the last time the button was clicked or from the time that the client started, whichever is later.
records the time and current statistics for each client, for use by the and options.
Copyright © 1995-2010 by Cogent Real-Time Systems, Inc. All rights reserved.