| OPC DataHub™ : Version 6.4 | ||
|---|---|---|
 | Chapter 20. Other Windows and Programs |  |
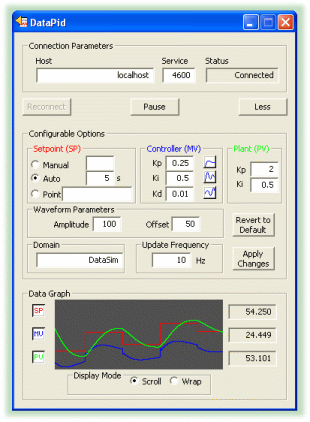
DataPid is a data simulation program for the OPC DataHub. It simulates data for a set point, control output, and process variable, and sends these values to the DataHub by a TCP connection.
![[Note]](images/note.gif) | This program is similar to DataSim, but with specialized data. A PID loop is often used by process control engineers to determine the efficiency of their system. A detailed explanation of PID loops is beyond the scope of this manual, but the data generated by this simulator can by used by anyone. |
The DataPid can be started from the Windows menu, the command line, or by clicking on the desktop icon.

As soon as DataPid starts, it attempts to connect to a DataHub and begins generating data. To receive the data, the OPC DataHub should be set up as a tunnelling master.
The DataPid can take several command-line arguments at startup, to assist in running more than one instance at a time. Any combination of the following arguments can be supplied in the Target field of the shortcut, or on the command line.
The name of the DataHub data domain in which to write the data that DataPid generates. The default is DataPid.
The name of the PID loop. For example, if data domain name is DataPid and pid name is PID1 then the data will the data will be created in a hierarchy beneath the point DataPid:PID1. The default is PID1.
The name of the computer on which the DataHub is running. This can be an address or a name, for example, 127.0.0.1 or developers.cogentrts.com. The default is localhost.
The port number on the target computer on which to connect. The default is 4600.
If specified, the DataPid window will be iconified when it starts.
Example:
DataPid.exe /i /d test /n pid
The name or IP address of the host computer. Since DataSim connects via TCP, this can be any computer on the network running a OPC DataHub acting as a tunnelling master.
The port number or service name as entered in the Master service/port entry box of the DataHub.
Displays the attempts to connect, which change to Connected when the connection is made.
You can use the button to reconnect and the button to freeze all data generation. Press the button to view and change some of the data parameters:

The following options can be set in DataPid, and sent to the OPC DataHub. All of the numeric options have a corresponding point in the DataHub that contains the value. Thus, these values can be set from within the Data Browser, by selecting the point name and entering a new value for it.
| Manual | A number from 0 to 100 to for the set point. An entry here overrides Auto. |
| Auto | Changes the set point randomly, every n seconds, where n is the number entered. |
| Point | Changes the set point according to a point registered in the DataHub. |
| Kp | The proportional control factor, sets the speed of adjustment. | The wave form button sets a well-tuned PID loop. |
| Ki | The integral control factor, reduces error. | The wave form button sets a poorly-tuned PID loop. |
| Kd | The derivative control factor, provides a damping effect. | The wave form button sets an oscillating PID loop. |
| Kp | The proportional control factor of the plant. |
| Ki | The integral control factor of the plant. |
| Amplitude | Not yet documented. |
| Offset | Not yet documented. |
The OPC DataHub data domain name for the data points. Any entry in this box changes the connection Status to IDLE. You must press the button to reestablish the connection.
The number of times per second that data changes and is sent to the OPC DataHub.
Applies any changes that have been entered for these configurable options. This button is greyed out until a change has been entered and can be applied.
The toggle button hides or shows the graph display. The numerical value is shown at the right of the graph.
Controls how the data is displayed in the trend display. moves the wave from right to left as the data is generated. Old data scrolls off the left side of the display as new data scrolls in from the right. adds to the wave from left to right, and writes over old data.
Copyright © 1995-2010 by Cogent Real-Time Systems, Inc. All rights reserved.