| OPC DataHub™ : Version 6.4 | ||
|---|---|---|
 | Chapter 20. Other Windows and Programs |  |
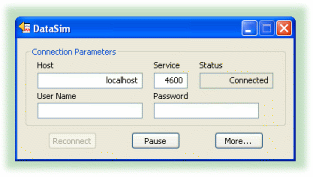
DataSim is a data simulation program that creates local data for the OPC DataHub. It generates data for four different wave patterns, and sends these to the DataHub by a TCP connection.

As soon as DataSim starts, it attempts to connect to a DataHub and begins generating data. To receive the data, the OPC DataHub should be set up as a tunnelling master.
The name or IP address of the host computer. Since DataSim connects via TCP, this can be any computer on the network running a OPC DataHub acting as a tunnelling master.
The port number or service name as entered in the Master service/port entry box of the DataHub.
Displays the attempts to connect, which change to Connected when the connection is made.
You can use the button to reconnect and the button to freeze all data generation. Press the button to view and change some of the data parameters:

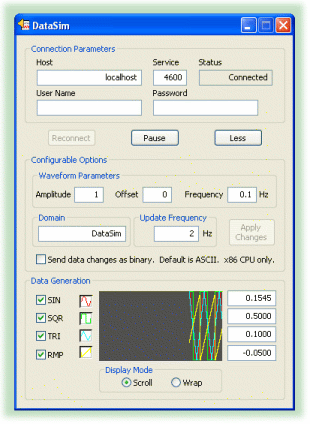
The following options can be set in DataSim, and sent to the OPC DataHub. All of the numeric options have a corresponding point in the DataHub that contains the value. Thus, these values can be set from within the Data Browser, by selecting the point name and entering a new value for it.
The height of the wave forms. DataHub Point name: Amplitude.
An offset from zero of the generated data, and thus the wave form. DataHub Point name: Offset.
The frequency of the wave form. DataHub Point name: Frequency.
The OPC DataHub data domain name for the data points. Any entry in this box changes the connection Status to IDLE. You must press the button to reestablish the connection.
The number of times per second that data changes and is sent to the OPC DataHub.
Applies any changes that have been entered for these configurable options. This button is greyed out until a change has been entered and can be applied.
Allows you to send the data changes from DataSim in binary form, rather than as ASCII characters. This can speed data update rates substantially. This feature is only available on x86 machines.
For each of the following four variables, the check box stops or starts data generation, while the toggle button hides or shows the graph display. The numerical value is shown at the right of the graph.
Data generates a sine wave.
Data generates a square wave.
Data generates a triangular (45 degree) wave pattern.
Data generates a ramp wave—steadily increasing, followed by a sudden drop.
Controls how the data is displayed in the trend display. moves the wave from right to left as the data is generated. Old data scrolls off the left side of the display as new data scrolls in from the right. adds to the wave from left to right, and writes over old data.
Copyright © 1995-2010 by Cogent Real-Time Systems, Inc. All rights reserved.