| DataHub Windows Scripting : Version 6.4 | ||
|---|---|---|
 | Chapter 2. Tutorials |  |
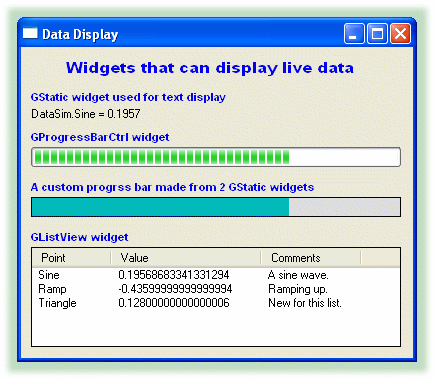
This tutorial illustrates four ways to display live data in a window: as text, with a progress bar, with a custom progress bar, or in a list.

The complete code for this tutorial is shown below, and is included in your DataHub distribution, in the scripts subdirectory, such as C:\Program Files\Cogent\DataHub\scripts\myscript.g. Please refer to Accessing Scripts in the DataHub Scripting manual for details on how to load and run a script.
require ("Application");
require ("WindowsSupport");

class MyDataDisplay Application
{
    window;
}

/* Adds items to a GListView widget. */
method MyDataDisplay.AddPoint (name, val, comment)
{
    local        n = lv.GetItemCount();
    lv.InsertItem (n, name);
    lv.SetItemText (n, 1, val);
    lv.SetItemText (n, 2, comment);
}

/* Changes the 2nd value of a GListView item. */
method MyDataDisplay.ChangeVal (name, val)
{
    local finfo = new LVFINDINFO();
    finfo.flags = LVFI_STRING;
    finfo.psz = name;
    local item = lv.FindItem (finfo, -1);
    lv.SetItemText (item, 1, string(val));
}

/* Formats a label for convenience. */
function format_label (win, letterh, letterw, font, color)
{
    win.SetForeground (0, 0, color);
    win.SetFontEx (letterh, letterw, 0, 0, 0, 0, 0, 0, 0, 0, 0, 0, 0, font);
}

/* Updates a value on a GStatic widget. */
function update (win, point)
{
    local        val, i;
    if (!undefined_p (val = eval(point)))
    point = string (point);
    if ((i = strchr (point, ':')) != -1)
        point = substr (point, i+1, -1);
    win.SetWindowText (format ("%s = %.4f", point, val));
}

/* Calculates the resize dimensions for a GStatic widget. */
function xrect (ptpos, low, high, pixels)
{
    local ret = int (((ptpos - low)/(high - low)) * (pixels));
}

/* The 'main line' of the program. */
method MyDataDisplay.constructor ()
{
    local    rect = CreateRect (0, 0, 300, 300), txt;
    local    x = 10, y = 10, w = 370, h = 20;

    /* Create the window, size and position it. */
    .window = new GWindow();
    .window.Create (0, rect, "Data Display", WS_OVERLAPPEDWINDOW, 0);
    .window.MoveWindow(20, 200, 400, 345);

    /* Set the same background color for the window and its children. */
    .window.SetBackground(0, GetSysColor (COLOR_3DFACE), 0);
    .window.SetChildBackground(0, GetSysColor (COLOR_3DFACE), 0);

    /* Allow for the possibility that DataSim isn't running.
     * Use the datahub_command function to send a cset command so
     * that the point will get created if it doesn't already exist. */
    $DataSim:Sine := 0;
    datahub_command("(cset DataSim:Sine 0)");
    datahub_command("(cset DataSim:Ramp 0)");
    datahub_command("(cset DataSim:Triangle 0)");

    /* Set a frequency and update rate for DataSim that suits this demo. */
    datahub_command("(cset DataSim:Frequency 0.02)");
    datahub_command("(cset DataSim:UpdateFrequency 5)");

    /* Create all labels. */
    txt = .window.CreateControl (GStatic, x, 12, w, h,
                                    "       Widgets that can display live data");
    format_label (txt, 18, 9, "Arial Bold", 0xee0000);
    txt = .window.CreateControl (GStatic, x, 43, w, h,
                                    "GStatic widget used for text display");
    format_label (txt, 14, 5, "Arial Bold", 0xee0000);
    txt = .window.CreateControl (GStatic, x, 83, w, h,
                                    "GProgressBarCtrl widget");
    format_label (txt, 14, 5, "Arial Bold", 0xee0000);
    txt = .window.CreateControl (GStatic, x, 133, w, h,
                                    "A custom progrss bar made from 2 GStatic widgets");
    format_label (txt, 14, 5, "Arial Bold", 0xee0000);
    txt = .window.CreateControl (GStatic, x, 183, w, h,
                                    "GListView widget");
    format_label (txt, 14, 5, "Arial Bold", 0xee0000);

    /* Create a text display for live Sine data. */
    stSine = .window.CreateControl (GStatic, x, 60, w, h, "Sine");
    .window.onChange (#$DataSim:Sine, `update (@stSine, this));

    /* Create a progress bar widget to display live Sine data. */
    pgSine = .window.CreateControl (GProgressBarCtrl, x, 100, w, h, "Sine");
    pgSine.SetRange(0, 100);
    .window.onChange (#$DataSim:Sine,
                        `((@pgSine).SetPos(($DataSim:Sine +.5) * 100)));
    pgSine.SetPos(($DataSim:Sine +.5) * 100);

    /* Create a custom progress bar out of two GStatic widgets for live Sine data. */
    rectSine = .window.CreateControl (GStatic, x, 150, w, h, "", WS_BORDER);
    rectSine.SetBackground(0, 0xdddddd, 0);
    fillSine = .window.CreateControl (GStatic, x + 1, 151, w/2, h - 2, "");
    fillSine.SetBackground(0, 0xbbbb00, 0);
    .window.onChange (#$DataSim:Sine,
            `((@fillSine).ResizeClient(xrect($DataSim:Sine, -.5, .5, @w), 18, 1)));


    /* Create a list view widget for live Sine, Ramp, and Triangle data. */
    lv = .window.CreateControl (GListViewCtrl, x, 200, w, h * 5, "lv", WS_BORDER);
    lv.SetViewType (1);
    lv.SetExtendedListViewStyle (LVS_EX_FULLROWSELECT | LVS_EX_ONECLICKACTIVATE,
                                  LVS_EX_FULLROWSELECT /*| LVS_EX_ONECLICKACTIVATE*/);

    lv.InsertColumn (0, "Point", 0, 80, 0);
    lv.InsertColumn (1, "Value", 0, 150, 0);
    lv.InsertColumn (2, "Comments", 0, 100, 0);
    lv.SetBackground (0, 0xffffff, 0);

    .AddPoint ("Sine", "No change" ,"A sine wave.");
    .AddPoint ("Ramp", "No change","Ramping up.");
    .AddPoint ("Triangle", "No change", "New for this list.");

    .window.onChange (#$DataSim:Sine,
                        `((@self).ChangeVal("Sine", $DataSim:Sine)));
    .window.onChange (#$DataSim:Ramp,
                        `((@self).ChangeVal("Ramp", $DataSim:Ramp)));
    .window.onChange (#$DataSim:Triangle,
                        `((@self).ChangeVal("Triangle", $DataSim:Triangle)));


    .window.MessageHandler (WM_DESTROY, `destroy(@self));
    .window.ShowWindow (SW_SHOW);
}

ApplicationSingleton (MyDataDisplay);
Copyright © 1995-2010 by Cogent Real-Time Systems, Inc. All rights reserved.