| Linux and QNX Tools Demo and Tutorials : Version 6.4 | ||
|---|---|---|
 | Chapter 2. Running the Cogent Tools Demo |  |
To make a text log of the data from the PID Emulator, click the button on the Controller to start the Log program.
|
| |
Log in GTK | Log in Photon 2 |
With the PID Emulator running, click the button to start the Cascade TextLogger. When you untoggle the button, the log file will be displayed in the text window.
Before or during logging, you can use the Collect: choices of , , or to determine which data gets logged. You can also select or deselect or to enable or disable those logs. While logging you can insert lines of text from the text entry field with the button, or send any command with the button. All the available commands are documented in the Cascade TextLogger manual.
![[Note]](images/note.gif) | This is not offered for QNX because the gnuplot utility is not available in that OS. However, the recent data from the PID Emulator is displayed in the Monitor. |
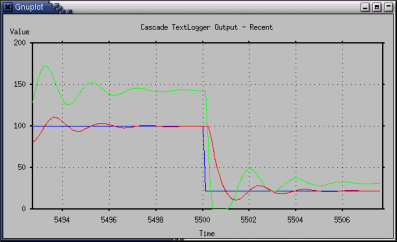
While the Cascade TextLogger is running, or after it has stopped, you can make plots of logs by pressing the or buttons. These buttons start the gnuplot program, which has been configured to reconstruct a plot of the relevant data files once every second. The "recent" plot shows the last 15 seconds of data.

![[Note]](images/note.gif) | We have configured gnuplot so that it enters a loop to create a new plot every second. To permanently close the plot window, you have to untoggle the or buttons. Otherwise the window will continue to be redrawn until the Log program exits. |
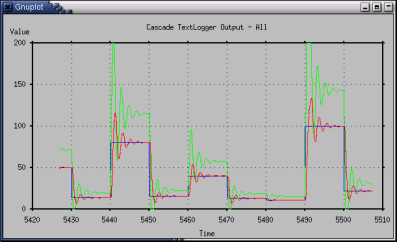
The "all" plot shows all the data logged from the last time the Cascade TextLogger was started. Since this plot can potentially contain very large data sets, you may find gnuplot hogging virtually all of your system resources if you plot logs for time spans over many minutes.

Copyright © 1995-2010 by Cogent Real-Time Systems, Inc. All rights reserved.